Setup a color scale of distinct discrete colors in ggplot2.
scale_color_chameleon.RdThis is a thin wrapper to ggplot2::discrete_scale('colour', 'chameleon', ...), which uses
the colors chosen by invoking distinct_colors. The order of the colors is arbitrary. If
the data has some structure the colors should reflect, use one of the many palettes available in
R, or using data_colors for automatically matching the colors to the structure of
multi-dimensional data.
scale_color_chameleon(
  minimal_saturation = 33,
  minimal_lightness = 20,
  maximal_lightness = 80,
  ...
)
Arguments
- minimal_saturation
Exclude colors whose saturation (
hypot(a, b)in CIELAB color space) is less than this value (by default, 33).- minimal_lightness
Exclude colors whose lightnes (
lin CIELAB color space) is less than this value (by default, 20).- maximal_lightness
Exclude colors whose lightnes (
lin CIELAB color space) is more than this value (by default, 80).- ...
Additional parameters for
discrete_scale.
Examples
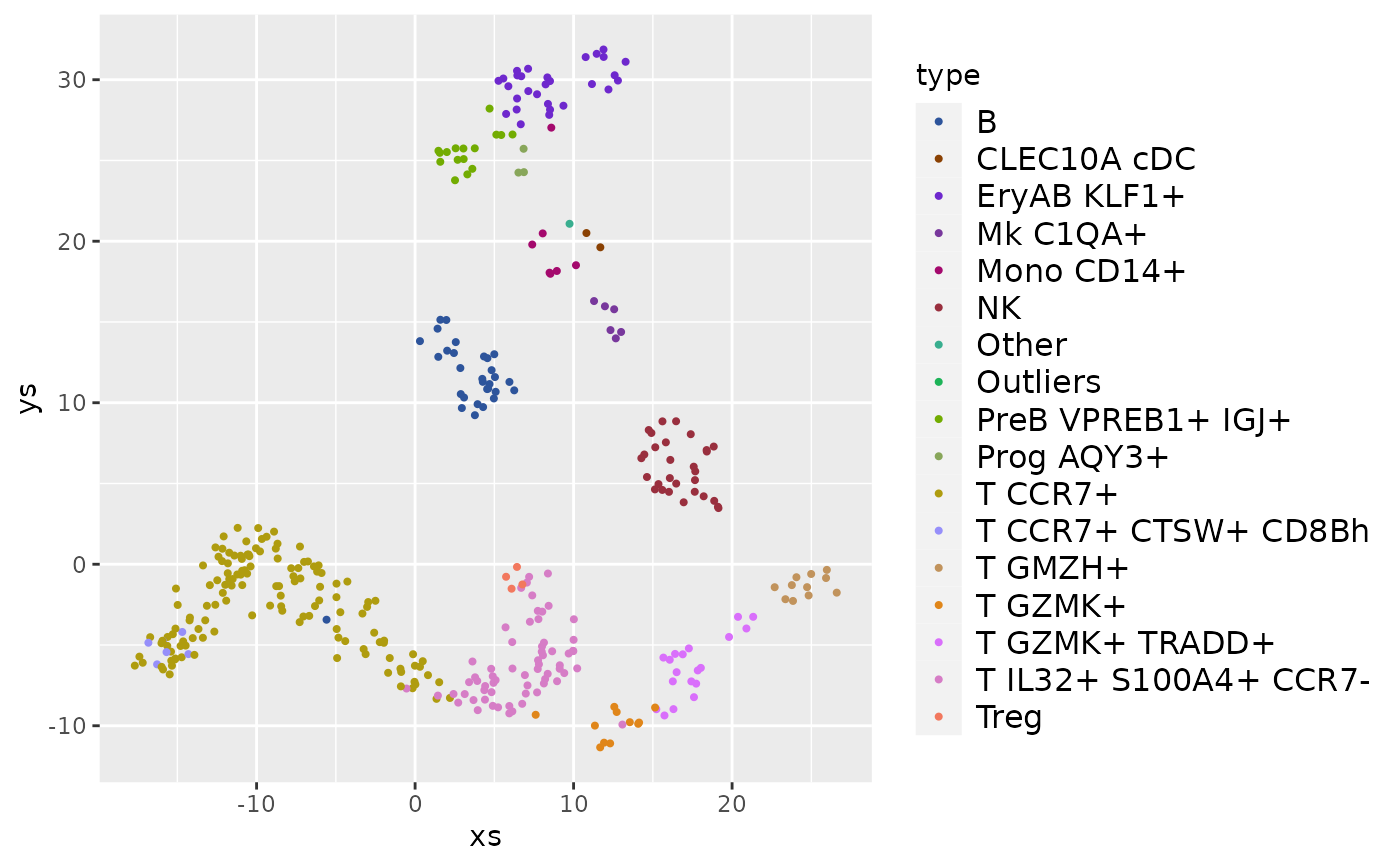
library(ggplot2)
data(pbmc)
frame <- as.data.frame(pbmc$umap)
frame$type <- pbmc$types
ggplot(frame, aes(x=xs, y=ys, color=type)) +
    geom_point(size=0.75) +
    scale_color_chameleon() +
    theme(legend.text=element_text(size=12), legend.key.height=unit(14, 'pt'))
#> Warning: Removed 12 rows containing missing values (geom_point).