Plot misha 1D tracks and annotations
Source:R/shaman_plot_map.R
shaman_plot_tracks_and_annotations.Rdshaman_plot_tracks_and_annotations
shaman_plot_tracks_and_annotations(
  genome,
  interval_range,
  misha_tracks = list(),
  mt_colors = getOption("shaman.track_colors"),
  mt_ylims = NULL,
  annotations = list(),
  a_colors = getOption("shaman.annotation_colors"),
  add_genes = TRUE,
  add_ideogram = TRUE,
  add_axis = TRUE,
  gene_stacking = "squish",
  gene_size = 0.7,
  track_size = 0.8,
  annotation_size = 0.7
)
Arguments
- genome
Name of reference genome (e.g. "hg19", "mm10")
- interval_range
1D interval (chrom, start, end) specifying the region to plot
- misha_tracks
List of 1D track expressions (virtual tracks also supported) which can be extracted from.
- mt_colors
Array of colors, one for each misha_track, which will be used to plot each 1d track.
- mt_ylims
Y-axis limits for each misha track. If not provided, generated automatically based on the data to be displayed in the region.
- annotations
List of gintervals highlighting annotated regions.
- a_colors
Array of colors, one for each annotation set.
- add_genes
Boolean flag indicating whether to show gene annotations.
- add_ideogram
Boolean flag indicating whether to add a chromosome ideogram.
- add_axis
Boolean flag indicating whether to show the chromosomal axis.
- gene_stacking
Describes the viewing option of the genes track. Can be either "squish", or "dense"
- gene_size
Size of gene annotation view
- track_size
Size of track view
- annotation_size
Size of annotation view
Value
Called for the plot. Returns what Gviz::plotTracks() returns, invisibly.
Needs the Bioconductor package Gviz.
Details
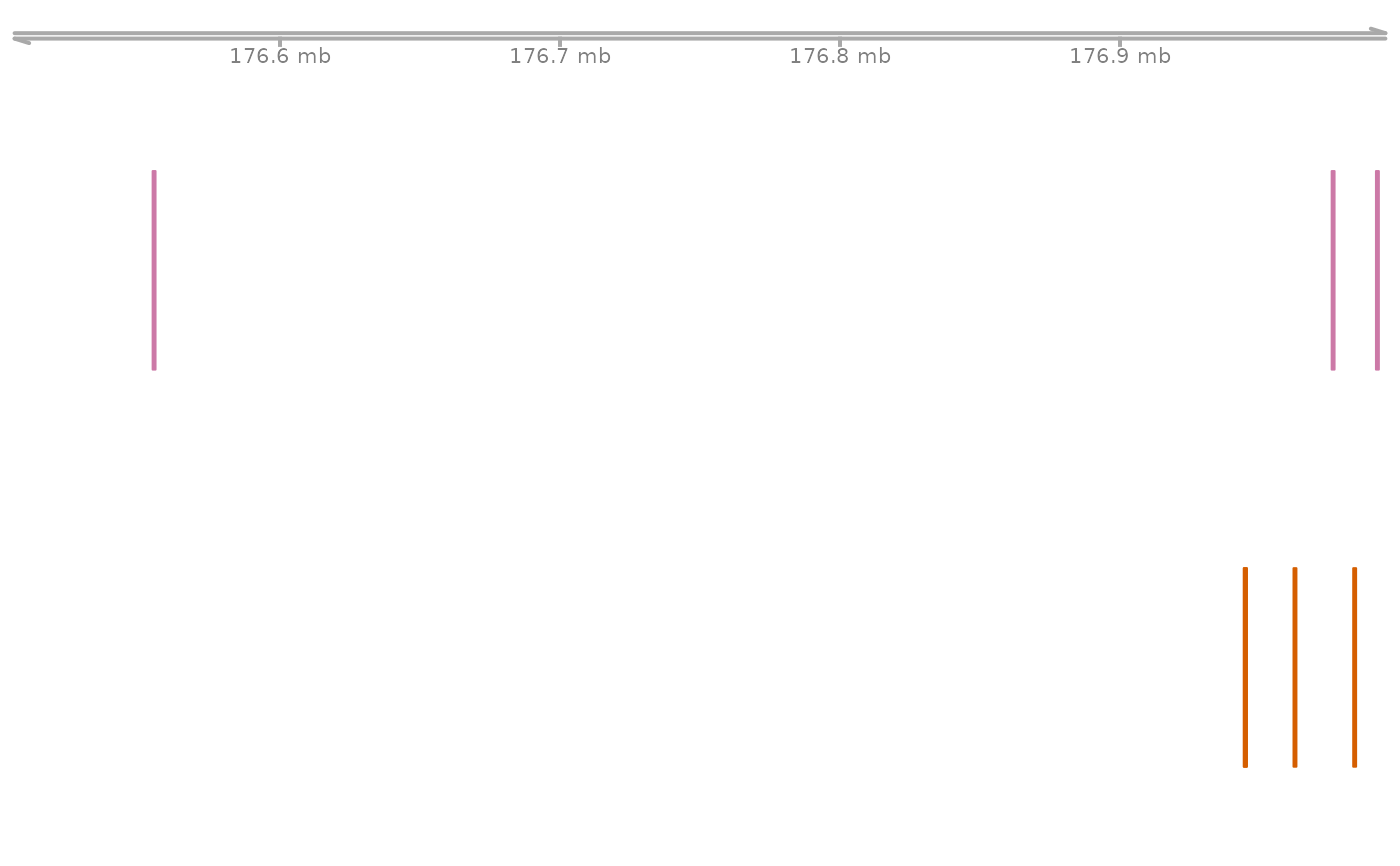
Plots 1D tracks in UCSC format. Along with gene annotations and chromosomal axis, this function plots one dimensional misha tracks (e.g. rna-seq, chip-seq data) and marks annotated intervals in the plotting region.
Examples
library(misha)
gsetroot(shaman_get_test_track_db())
# the test db has chr2 only
ctcf <- list(
ctcf_forward[ctcf_forward$chrom == "chr2", ],
ctcf_reverse[ctcf_reverse$chrom == "chr2", ]
)
# \donttest{
# loading Gviz takes a few seconds
if (requireNamespace("Gviz", quietly = TRUE)) {
shaman_plot_tracks_and_annotations("hg19", gintervals(2, 176.5e06, 177e06),
annotations = ctcf, add_genes = FALSE, add_ideogram = FALSE
)
}
 # }
# gene annotations and the ideogram are downloaded from UCSC
if (interactive() && requireNamespace("Gviz", quietly = TRUE)) {
shaman_plot_tracks_and_annotations("hg19", gintervals(2, 176.5e06, 177e06), annotations = ctcf)
}
# }
# gene annotations and the ideogram are downloaded from UCSC
if (interactive() && requireNamespace("Gviz", quietly = TRUE)) {
shaman_plot_tracks_and_annotations("hg19", gintervals(2, 176.5e06, 177e06), annotations = ctcf)
}