Normalize lab values to age and sex
ln_normalize.RdNormalize standard laboratory measurements (e.g. hemoglobin, cholesterol levels) according to age and sex, based on the algorithms described in "Personalized lab test models to quantify disease potentials in healthy individuals" doi:10.1038/s41591-021-01468-6
.
The "Clalit" reference distributions are based on 2.1B lab measurements taken from 2.8M individuals between 2002-2019, filtered to exclude severe chronic diseases and medication effects. The resulting normalized value is a quantile between 0 and 1, representing the value's position in the reference distribution.
The "UKBB" reference distributions are based on the UK-Biobank, a large-scale population-based cohort study of 500K individuals, which underwent the same filtering process as the "Clalit" reference distributions.
The list of supported labs can be found below or by running LAB_DETAILS$short_name.
ln_normalize(
  values,
  age,
  sex,
  lab,
  units = NULL,
  reference = "Clalit",
  na.rm = FALSE
)

ln_normalize_multi(labs_df, reference = "Clalit", na.rm = FALSE)

ln_normalize_ukbb(
  values,
  age,
  sex,
  lab_code,
  reference = "UKBB",
  na.rm = FALSE
)

ln_normalize_multi_ukbb(labs_df, reference = "UKBB", na.rm = FALSE)

ln_normalize_multi_clalit(labs_df, reference = "Clalit", na.rm = FALSE)

ln_normalize_clalit(
  values,
  age,
  sex,
  lab_code,
  reference = "Clalit",
  na.rm = FALSE
)
Arguments
- values
a vector of lab values
- age
a vector of ages between 20-89 for "Clalit" reference and 35-80 for "UKBB". Can be a single value if all values are the same age.
- sex
a vector of either "male" or "female". Can be a single value if all values are the same sex.
- lab
the lab name. See
LAB_DETAILS$short_namefor a list of available labs.- units
the units of the lab values. See
ln_lab_units(lab)for a list of available units for each lab. IfNULLthen the default units (ln_lab_default_units(lab)) for the lab will be used. If different values have different units then this should be a vector of the same length asvalues.- reference
the reference distribution to use. Can be either "Clalit" or "UKBB" or "Clalit-demo". Please download the Clalit and UKBB reference distributions using
ln_download_data().- na.rm
if
TRUE, thenNAin age, sex or values will be ignored and 'NA' would be returned. Otherwise, an error will be thrown.- labs_df
a data frame with the columns "value", "age", "sex", "units", and "lab". The "lab" column should be a vector with the lab name per row. See
ln_normalizefor details on the other columns. Forln_normalize_multi_ukbbandln_normalize_multi_clalit, a column named "lab_code" should be added with the lab code instead of the "lab" column.- lab_code
Clalit lab code (e.g. "lab.103" for hemoglobin). You can see the available labs by running
ln_ukbb_labs().
Value
a vector of normalized values. If ln_download_data() was not run, a lower resolution reference distribution will be used, which can have an error of up to 5 quantiles (0.05). Otherwise, the full reference distribution will be used. You can check if the high resolution data was downloaded using ln_data_downloaded().
You can force the function to use the lower resolution distribution by setting options(labNorm.use_low_res = TRUE).
If the quantile information is not available (e.g. "Estradiol" for male patients, various labs which are not available in the UKBB data), then the function will return NA.
reference distribution
It is highly recommended to use ln_download_data to download the "Clalit" and "UKBB" reference distributions. If you choose not to download the data, the package will use the demo reference distributions included in the package ("Clalit-demo"), which doesn't include all the labs, and has a resolution of 20 quantile bins and therefore may have an error of up to 5 percentiles (0.05), particularly at the edges of the distribution.
labs
The following labs are supported in the "Clalit" reference (some labs are missing from the UKBB reference):
WBC
RBC
Hemoglobin
Hematocrit
Platelets
MCV
MCH
MCHC
RDW
MPV
Large unstained cells, Abs
Albumin
Total Cholesterol
Triglycerides
BMI
Iron
Transferrin
Ferritin
PDW
MPXI
Total Globulin
PCT
HDW
Fibrinogen
CH
Chloride
Large unstained cells, %
Macrocytic
Microcytic
Hyperchromic
Hypochromic
Lymphocytes, Abs
Lymphocytes, %
Neutrophils, Abs
Neutrophils, %
Monocytes, Abs
Monocytes, %
Eosinophils, Abs
Eosinophils, %
Basophils, Abs
Basophils, %
Microcytic:Hypochromic
Glucose
Urea
Creatinine
Uric Acid
Calcium
Phosphorus
Total Protein
HDL Cholesterol
LDL Cholesterol
Alk. Phosphatase
AST
ALT
GGT
LDH
CPK
Total Bilirubin
Direct Bilirubin
Hemoglobin A1c
Sodium
Potassium
Vitamin D (25-OH)
Microalbumin:Creatinine
Urine Creatinine
Urine Microalbumin
Non-HDL
TSH
T3, Free
T4, Free
Blood Pressure, Systolic
Blood Pressure, Diastolic
Urine Specific Gravity
Urine pH
PT, INR
PT, sec
PT, %
Vitamin B12
PSA
ESR
aPTT, sec
CRP
Amylase
Folic Acid
Total:HDL
Hematocrit:Hemoglobin
Magnesium
aPTT, ratio
Indirect Bilirubin
RDW-SD
RDW-CV
LH
Estradiol
Examples
# \donttest{
# Normalize Hemoglobin values to age and sex
hemoglobin_data$quantile <- ln_normalize(
hemoglobin_data$value,
hemoglobin_data$age,
hemoglobin_data$sex,
"Hemoglobin"
)
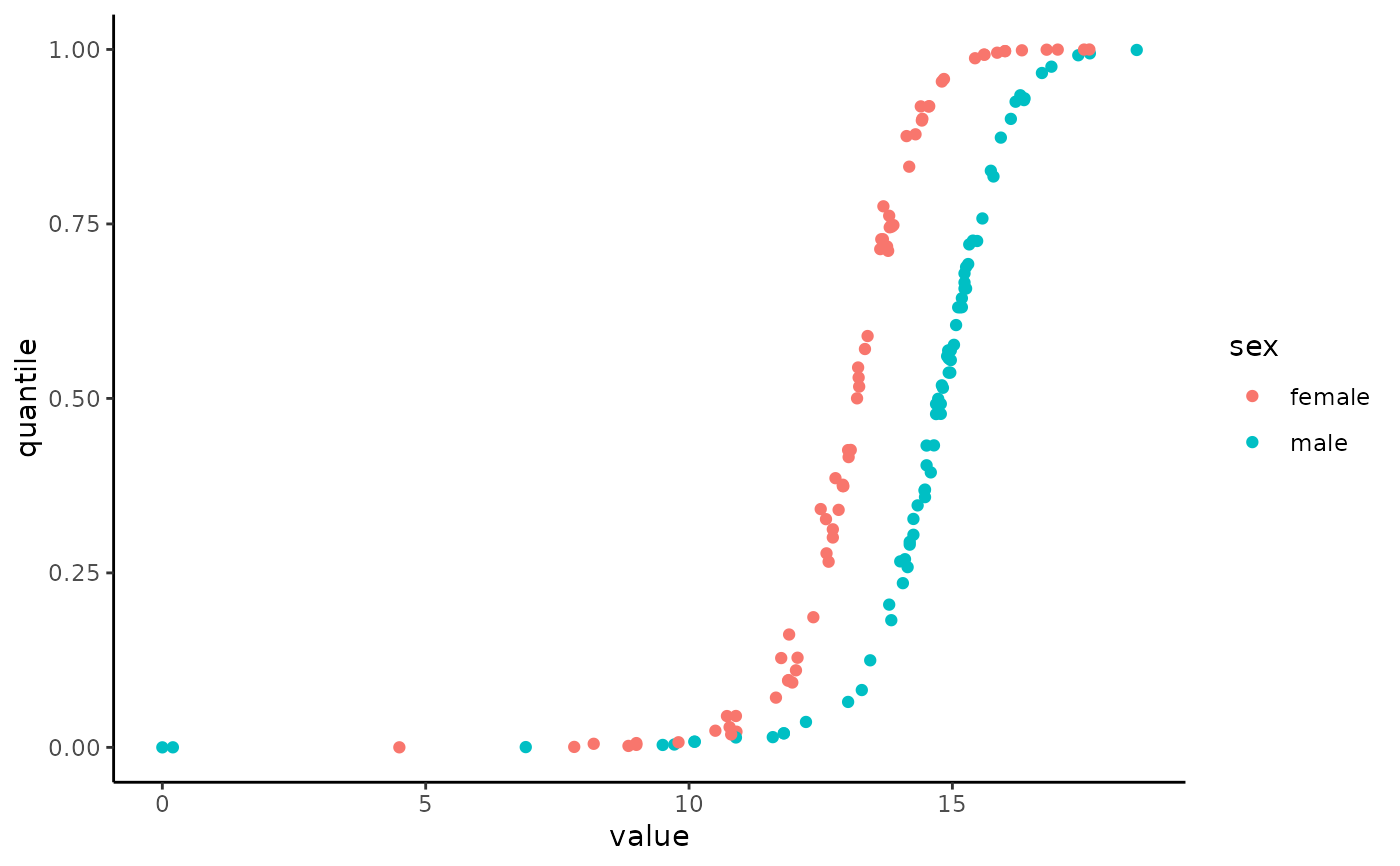
# plot the quantiles vs values for age 50-60
library(ggplot2)
library(dplyr)
#>
#> Attaching package: ‘dplyr’
#> The following objects are masked from ‘package:stats’:
#>
#> filter, lag
#> The following objects are masked from ‘package:base’:
#>
#> intersect, setdiff, setequal, union
hemoglobin_data %>%
filter(age >= 50 & age <= 60) %>%
ggplot(aes(x = value, y = quantile, color = sex)) +
geom_point() +
theme_classic()
 # Different units
hemoglobin_diff_units <- hemoglobin_data
hemoglobin_diff_units$value <- hemoglobin_diff_units$value * 0.1
hemoglobin_diff_units$quantile <- ln_normalize(
hemoglobin_data$value,
hemoglobin_data$age,
hemoglobin_data$sex,
"Hemoglobin",
"mg/mL"
)
#> ℹ Converting mg/mL to g/dL for lab Hemoglobin. Using the formula `0.1 * x`.
# Multiple units
creatinine_diff_units <- creatinine_data
creatinine_diff_units$value <- c(
creatinine_diff_units$value[1:500] * 0.011312,
creatinine_diff_units$value[501:1000] * 11.312
)
creatinine_diff_units$quantile <- ln_normalize(
creatinine_diff_units$value,
creatinine_diff_units$age,
creatinine_diff_units$sex,
"Creatinine",
c(rep("umol/L", 500), rep("mmol/L", 500))
)
#> ℹ Converting umol/L to mg/dL for lab Creatinine. Using the formula `0.011312 * x`.
#> ℹ Converting mmol/L to mg/dL for lab Creatinine. Using the formula `11.312 * x`.
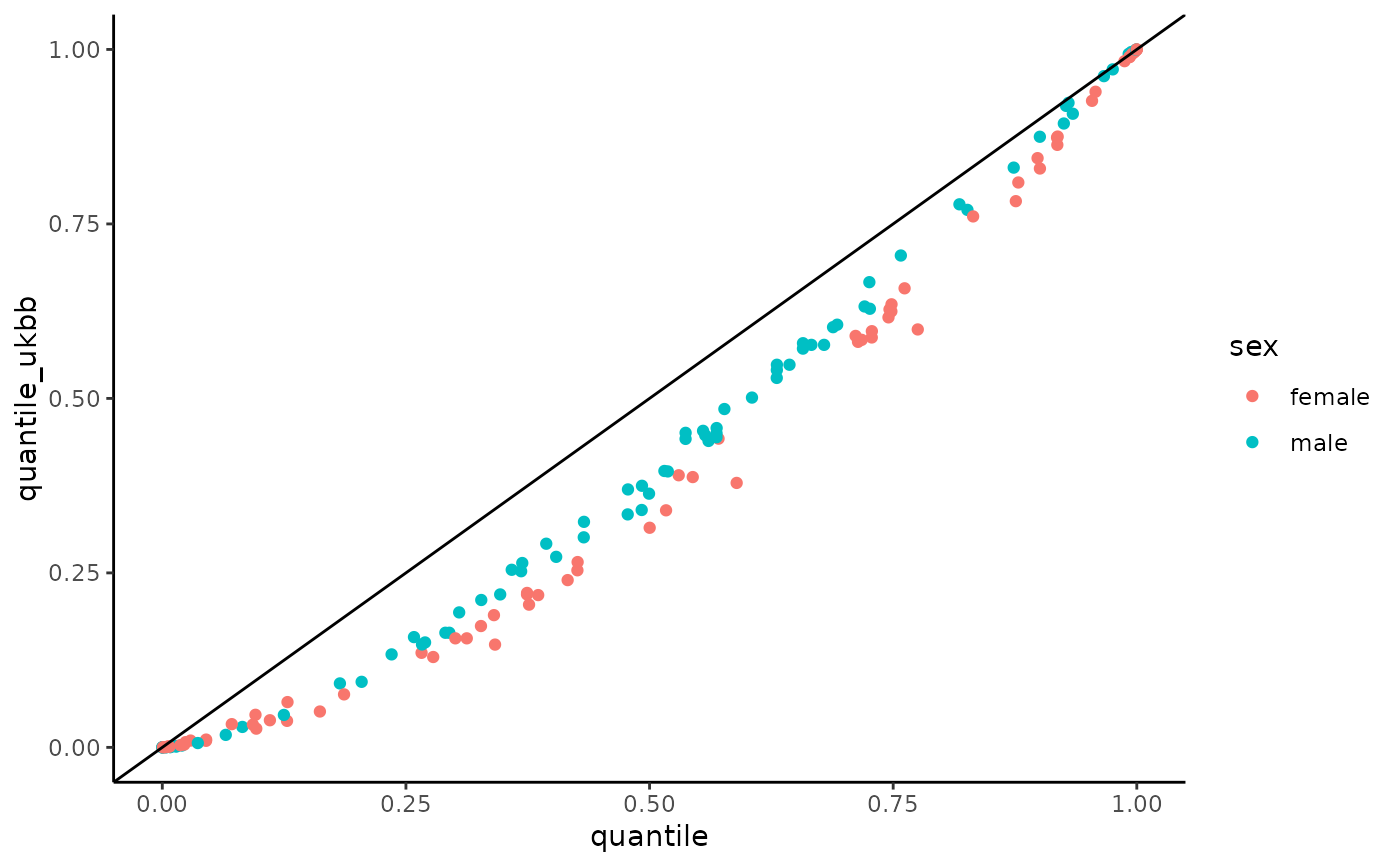
# Use UKBB as reference
hemoglobin_data_ukbb <- hemoglobin_data %>% filter(age >= 35 & age <= 80)
hemoglobin_data_ukbb$quantile_ukbb <- ln_normalize(
hemoglobin_data_ukbb$value,
hemoglobin_data_ukbb$age,
hemoglobin_data_ukbb$sex,
"Hemoglobin",
reference = "UKBB"
)
# plot UKBB vs Clalit
hemoglobin_data_ukbb %>%
filter(age >= 50 & age <= 60) %>%
ggplot(aes(x = quantile, y = quantile_ukbb, color = sex)) +
geom_point() +
geom_abline() +
theme_classic()
# Different units
hemoglobin_diff_units <- hemoglobin_data
hemoglobin_diff_units$value <- hemoglobin_diff_units$value * 0.1
hemoglobin_diff_units$quantile <- ln_normalize(
hemoglobin_data$value,
hemoglobin_data$age,
hemoglobin_data$sex,
"Hemoglobin",
"mg/mL"
)
#> ℹ Converting mg/mL to g/dL for lab Hemoglobin. Using the formula `0.1 * x`.
# Multiple units
creatinine_diff_units <- creatinine_data
creatinine_diff_units$value <- c(
creatinine_diff_units$value[1:500] * 0.011312,
creatinine_diff_units$value[501:1000] * 11.312
)
creatinine_diff_units$quantile <- ln_normalize(
creatinine_diff_units$value,
creatinine_diff_units$age,
creatinine_diff_units$sex,
"Creatinine",
c(rep("umol/L", 500), rep("mmol/L", 500))
)
#> ℹ Converting umol/L to mg/dL for lab Creatinine. Using the formula `0.011312 * x`.
#> ℹ Converting mmol/L to mg/dL for lab Creatinine. Using the formula `11.312 * x`.
# Use UKBB as reference
hemoglobin_data_ukbb <- hemoglobin_data %>% filter(age >= 35 & age <= 80)
hemoglobin_data_ukbb$quantile_ukbb <- ln_normalize(
hemoglobin_data_ukbb$value,
hemoglobin_data_ukbb$age,
hemoglobin_data_ukbb$sex,
"Hemoglobin",
reference = "UKBB"
)
# plot UKBB vs Clalit
hemoglobin_data_ukbb %>%
filter(age >= 50 & age <= 60) %>%
ggplot(aes(x = quantile, y = quantile_ukbb, color = sex)) +
geom_point() +
geom_abline() +
theme_classic()
 # }
# examples on the demo data
# \dontshow{
hemoglobin_data$quantile <- ln_normalize(
hemoglobin_data$value,
hemoglobin_data$age,
hemoglobin_data$sex,
"Hemoglobin",
reference = "Clalit-demo"
)
# }
library(dplyr)
multi_labs_df <- bind_rows(
hemoglobin_data %>% mutate(lab = "Hemoglobin"),
creatinine_data %>% mutate(lab = "Creatinine")
)
# \donttest{
multi_labs_df$quantile <- ln_normalize_multi(multi_labs_df)
# }
# on the demo data
# \dontshow{
multi_labs_df$quantile <- ln_normalize_multi(multi_labs_df, reference = "Clalit-demo")
# }
head(multi_labs_df)
#> age sex value quantile lab
#> 1 20 male 9.39 0.03838718 Hemoglobin
#> 2 20 male 14.03 0.18914947 Hemoglobin
#> 3 20 male 14.44 0.28589076 Hemoglobin
#> 4 20 male 15.80 0.75032395 Hemoglobin
#> 5 20 female 12.06 0.24222206 Hemoglobin
#> 6 20 female 12.89 0.55270091 Hemoglobin
if (FALSE) {
hemoglobin_data1 <- hemoglobin_data
hemoglobin_data1$age <- 50
hemoglobin_data1$quantile <- ln_normalize_ukbb(
hemoglobin_data1$value,
hemoglobin_data1$age,
hemoglobin_data1$sex,
"30020"
)
head(hemoglobin_data1)
}
if (FALSE) {
library(dplyr)
multi_labs_df <- bind_rows(
hemoglobin_data %>% mutate(age = 50, lab_code = "30020"),
creatinine_data %>% mutate(age = 50, lab_code = "30700")
)
multi_labs_df$quantile <- ln_normalize_multi_ukbb(multi_labs_df)
head(multi_labs_df)
}
library(dplyr)
multi_labs_df <- bind_rows(
hemoglobin_data %>% mutate(lab_code = "lab.103"),
creatinine_data %>% mutate(lab_code = "lab.20300")
)
# \donttest{
multi_labs_df$quantile <- ln_normalize_multi_clalit(multi_labs_df)
# }
# on the demo data
# \dontshow{
multi_labs_df$quantile <- ln_normalize_multi_clalit(multi_labs_df, reference = "Clalit-demo")
# }
head(multi_labs_df)
#> age sex value quantile lab_code
#> 1 20 male 9.39 0.03838718 lab.103
#> 2 20 male 14.03 0.18914947 lab.103
#> 3 20 male 14.44 0.28589076 lab.103
#> 4 20 male 15.80 0.75032395 lab.103
#> 5 20 female 12.06 0.24222206 lab.103
#> 6 20 female 12.89 0.55270091 lab.103
if (FALSE) {
hemoglobin_data$quantile <- ln_normalize_clalit(
hemoglobin_data$value,
hemoglobin_data$age,
hemoglobin_data$sex,
"lab.103"
)
}
# }
# examples on the demo data
# \dontshow{
hemoglobin_data$quantile <- ln_normalize(
hemoglobin_data$value,
hemoglobin_data$age,
hemoglobin_data$sex,
"Hemoglobin",
reference = "Clalit-demo"
)
# }
library(dplyr)
multi_labs_df <- bind_rows(
hemoglobin_data %>% mutate(lab = "Hemoglobin"),
creatinine_data %>% mutate(lab = "Creatinine")
)
# \donttest{
multi_labs_df$quantile <- ln_normalize_multi(multi_labs_df)
# }
# on the demo data
# \dontshow{
multi_labs_df$quantile <- ln_normalize_multi(multi_labs_df, reference = "Clalit-demo")
# }
head(multi_labs_df)
#> age sex value quantile lab
#> 1 20 male 9.39 0.03838718 Hemoglobin
#> 2 20 male 14.03 0.18914947 Hemoglobin
#> 3 20 male 14.44 0.28589076 Hemoglobin
#> 4 20 male 15.80 0.75032395 Hemoglobin
#> 5 20 female 12.06 0.24222206 Hemoglobin
#> 6 20 female 12.89 0.55270091 Hemoglobin
if (FALSE) {
hemoglobin_data1 <- hemoglobin_data
hemoglobin_data1$age <- 50
hemoglobin_data1$quantile <- ln_normalize_ukbb(
hemoglobin_data1$value,
hemoglobin_data1$age,
hemoglobin_data1$sex,
"30020"
)
head(hemoglobin_data1)
}
if (FALSE) {
library(dplyr)
multi_labs_df <- bind_rows(
hemoglobin_data %>% mutate(age = 50, lab_code = "30020"),
creatinine_data %>% mutate(age = 50, lab_code = "30700")
)
multi_labs_df$quantile <- ln_normalize_multi_ukbb(multi_labs_df)
head(multi_labs_df)
}
library(dplyr)
multi_labs_df <- bind_rows(
hemoglobin_data %>% mutate(lab_code = "lab.103"),
creatinine_data %>% mutate(lab_code = "lab.20300")
)
# \donttest{
multi_labs_df$quantile <- ln_normalize_multi_clalit(multi_labs_df)
# }
# on the demo data
# \dontshow{
multi_labs_df$quantile <- ln_normalize_multi_clalit(multi_labs_df, reference = "Clalit-demo")
# }
head(multi_labs_df)
#> age sex value quantile lab_code
#> 1 20 male 9.39 0.03838718 lab.103
#> 2 20 male 14.03 0.18914947 lab.103
#> 3 20 male 14.44 0.28589076 lab.103
#> 4 20 male 15.80 0.75032395 lab.103
#> 5 20 female 12.06 0.24222206 lab.103
#> 6 20 female 12.89 0.55270091 lab.103
if (FALSE) {
hemoglobin_data$quantile <- ln_normalize_clalit(
hemoglobin_data$value,
hemoglobin_data$age,
hemoglobin_data$sex,
"lab.103"
)
}