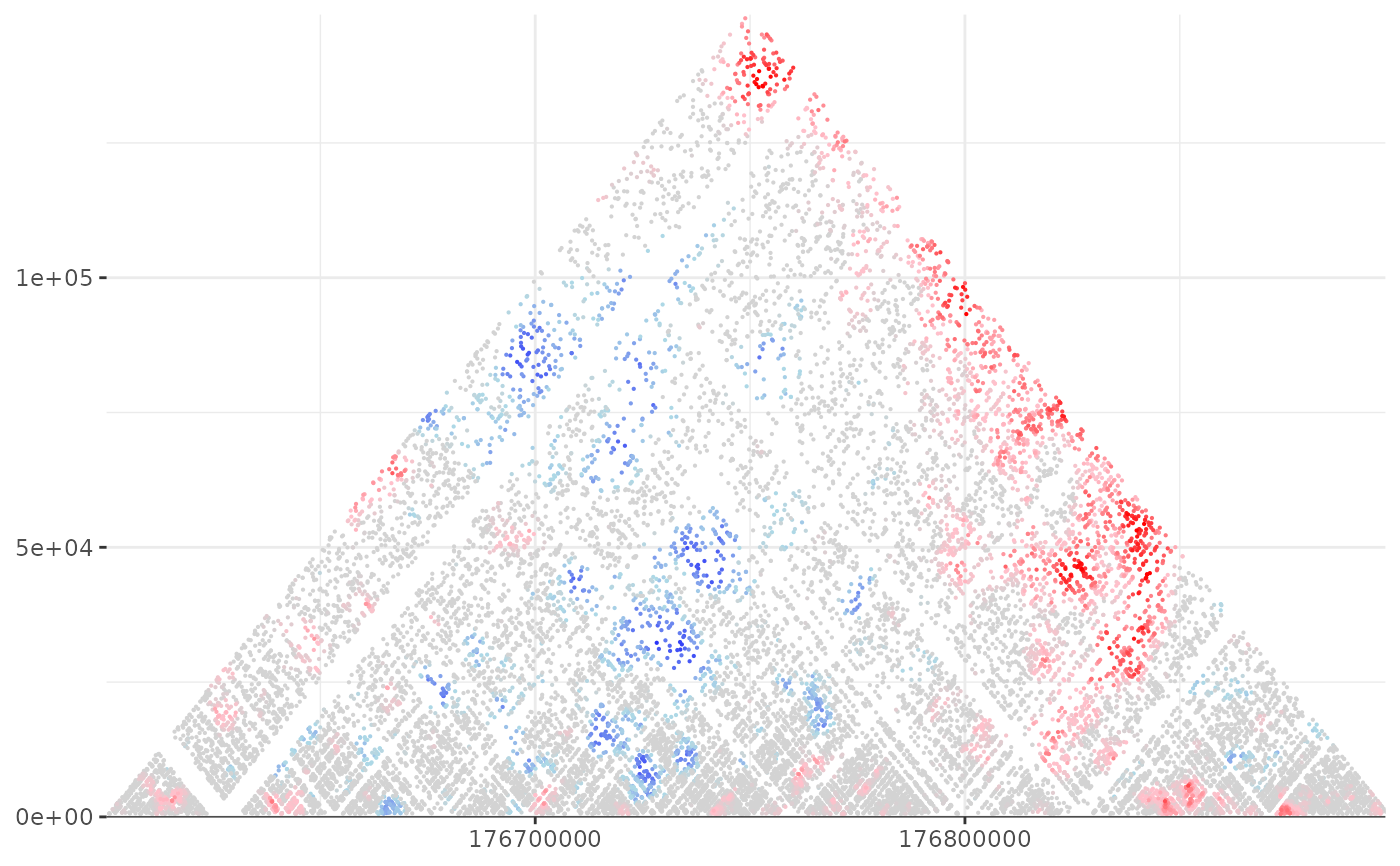
Compute a score matrix for observed data based on the expected for a given set of points
Source:R/shaman.R
shaman_kk_norm.Rdshaman_kk_norm
shaman_kk_norm(obs, exp, points, k = 100, k_exp = 100)Arguments
- obs
Dataframe containing the observed points
- exp
Dataframe containing the expected (shuffled) points.
- points
A score will be computed for each of the points.
- k
The number of neighbor distances used for the score on observed data. For higher resolution maps, increase k. For lower resolution maps, decrease k.
- k_exp
The number of neighbor distances used for the score on expected data. Should reflect the ratio between the total number of observed and expected over the entire chromosome.
Value
NULL if insufficient observed data, otherwise returns a list containing 3 elements: 1) points - start1, start2 and score for all observed points. 2) obs - the observed points. 3) exp - the expected points.
Details
This function receives observed and expected data and computes the score on a given set of points. The score for a point is the KS D-statistic of the distances to its k nearest neighbors in the observed data compared to the expected data.
Examples
# Set misha db to test
library(misha)
gsetroot(shaman_get_test_track_db())
focus <- gintervals.2d(2, 176.6e06, 176.9e06, 2, 176.6e06, 176.9e06)
regional <- gintervals.2d(2, 176.5e06, 177e06, 2, 176.5e06, 177e06)
points <- gextract("hic_obs", focus, band = c(-5e05, -1024))
obs <- gextract("hic_obs", regional, band = c(-5e05, -1024))
exp <- gextract("hic_exp", regional, band = c(-5e05, -1024))
mat_score <- shaman_kk_norm(obs, exp, points, k = 100, k_exp = 200)
#> going into knn with 45150 observed and 88262 expected
#> going into shuffled knn
shaman_gplot_map_score(mat_score$points)