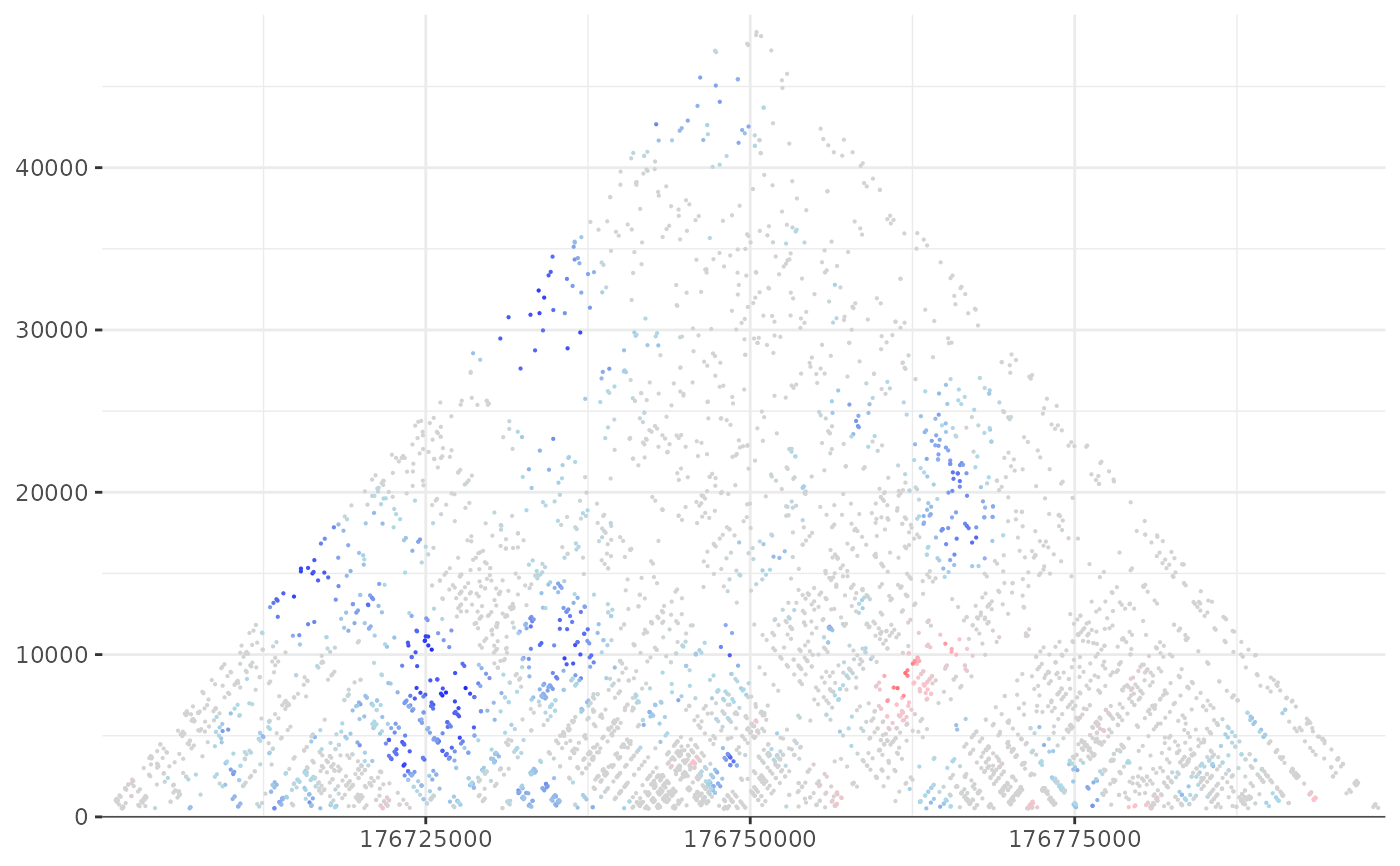
Generate a score matrix for observed data based on the expected for a given 2D focus interval
Source:R/shaman.R
shaman_score_hic_mat.Rdshaman_score_hic_mat
shaman_score_hic_mat(
  obs_track_nms,
  exp_track_nms,
  focus_interval,
  regional_interval,
  points_track_nms = obs_track_nms,
  min_dist = 1024,
  k = 100,
  k_exp = 2 * k
)
Arguments
- obs_track_nms
Names of observed 2D genomic tracks for the hic data. Pooling of multiple observed tracks is supported.
- exp_track_nms
Names of expected (shuffled) 2D genomic tracks. Pooling of multiple expected tracks is supported.
- focus_interval
2D interval on which to compute the scores.
- regional_interval
An expansion of the focus interval, including points outside the focus matrix for accurate computing of the score. Note that for each observed point, its k-nearest neighbors must be included in the expanded matrix.
- points_track_nms
Names of 2D genomic tracks that contain points on which to compute normalized score. Pooling points from multiple tracks is supported.
- min_dist
The minimum distance between points.
- k
The number of neighbor distances used for the score. For higher resolution maps, increase k. For lower resolution maps, decrease k.
- k_exp
The number of neighbor distances used for the score on the expected tracks. Note, that when comparing expected generated by shuffling the observed, k_exp should be 2*k as the number of contacts in the expected track will always be twice the observed. However, if comparing between two datasets that are independent, k_exp should be set to NA and the will be determined by the ratio between the total number of contacts in this region.
Value
NULL if insufficient observed data, otherwise a list with one element: points - the points in the focus interval (chrom1, start1, end1, chrom2, start2, end2) and their score.
Details
This function extracts observed data and expected data in an expanded matrix and computes the score for each observed point. The score for a point is the KS D-statistic of the distances to its k nearest neighbors in the observed data compared to the expected data.
Examples
# Set misha db to test
library(misha)
gsetroot(shaman_get_test_track_db())
mat_score <- shaman_score_hic_mat(
    obs_track_nms = "hic_obs", exp_track_nms = "hic_exp",
    focus_interval = gintervals.2d(2, 176.7e06, 176.8e06, 2, 176.7e06, 176.8e06),
    regional_interval = gintervals.2d(2, 176.5e06, 177e06, 2, 176.5e06, 177e06)
)
#> kk norm on 10306 points
#> obs =  hic_obs
#> n_obs = 97618, n_exp = 200292, k_exp = 200
shaman_gplot_map_score(mat_score$points)