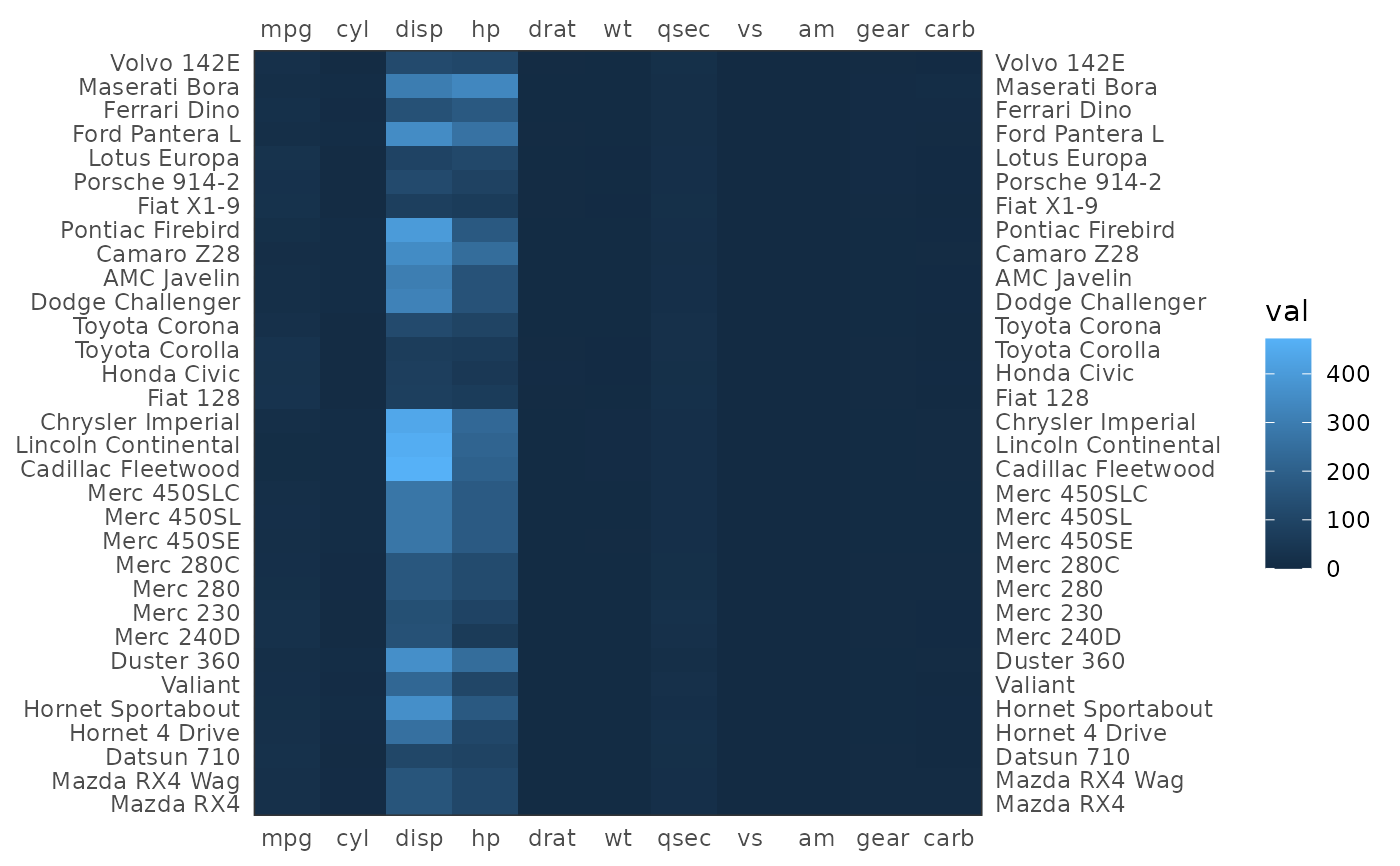
Easily plot a matrix as an heatmap using ggplot2
tgplot_heatmap(
  mtrx,
  col_names = NULL,
  row_names = NULL,
  xlab = NULL,
  ylab = NULL,
  plot_top = TRUE,
  plot_right = TRUE,
  interleave = FALSE,
  col_names_orient = c("horizontal", "vertical", "slanted"),
  col_names_color = "black"
)
Arguments
- mtrx
The matrix to be plotted
- col_names
The names that will be used as the X-axis labels. A NULL (the defualt) indicates that the original matrix colnames are used. A FALSE indicates that no X-axis labels should be displayed.
- row_names
The names that will be used as the Y-axis labels. A NULL (the defualt) indicates that the original matrix rownames are used. A FALSE indicates that no Y-axis labels should be displayed.
- xlab
The X-axis label
- ylab
The Y-axis label
- plot_top
Whether to put the X-axis labels at the top of the heatmap (as well as at the bottom)
- plot_right
Whether to put the Y-axis labels at the right side of the heatmap (as well as at the left hand side)
- interleave
Plot the odd Y-Axis labels on the left side and the even on the right side
- col_names_orient
Orientation of the X-axis label
- col_names_color
color of the column names
Value
ggplot object with the matrix plot
Examples
tgplot_heatmap(as.matrix(mtcars))