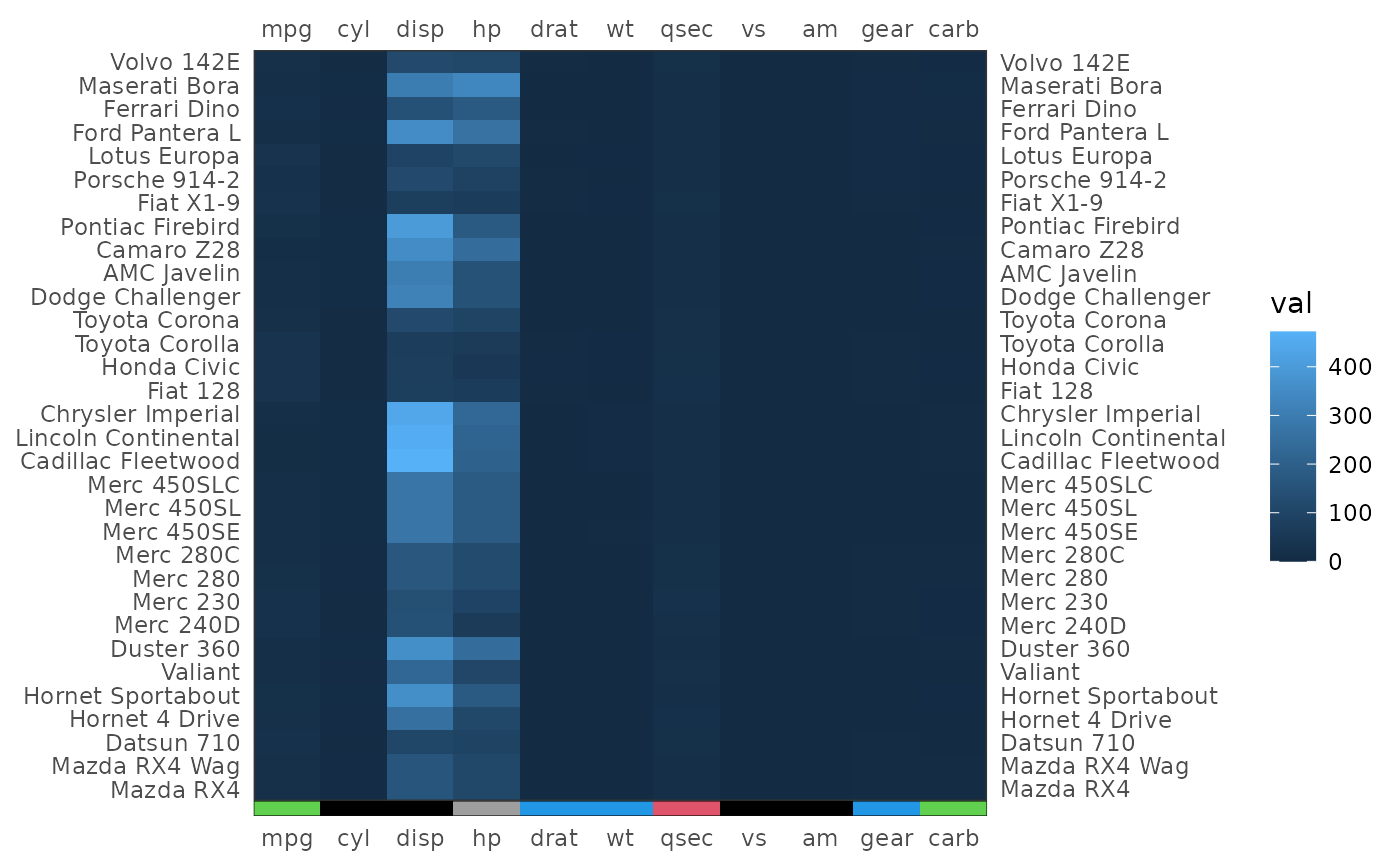
Add an axis annotation to a ggplot matrix
tgplot_add_axis_annotation(
  heatmap,
  annotation,
  position = "bottom",
  size = 0.02,
  label = NULL,
  plot_left = TRUE,
  plot_right = TRUE,
  label_color = "black"
)
Arguments
- heatmap
a ggplot matrix object - output of
tgplot_heatmap- annotation
can be either a vector of colors or a ggplot object
- position
position of the axis annotation ("top", "bottom", "left" or "right")
- size
width of the annotation
- label
annotation label (optional)
- plot_left
plot a label to the left of the annotation
- plot_right
plot a label to the right of the annotation
- label_color
color of the annotation label
Value
a gtable object. Can be plotted using cowplot::ggdraw.
Examples
tgplot_heatmap(as.matrix(mtcars)) %>%
    tgplot_add_axis_annotation(as.matrix(mtcars)[5, ] + 1) %>%
    cowplot::ggdraw()